Announcing Reports
Anders Eiler
Founder
Jan 30, 2024
When handling tens, hundreds or thousands of conversations with your customers across multiple channels every month, it becomes increasingly important to be able to drill down into the data to see and understand where the workload is coming from and if it’s being handled correctly.
When handling tens, hundreds or thousands of conversations with your customers across multiple channels every month, it becomes increasingly important to be able to drill down into the data to see and understand where the workload is coming from and if it’s being handled correctly.
To help you do that, we have now released a new Reports module.
All users with Admin or Manager rights will now see a new “Reports”-tab in the top menu. This will lead to the new reports section.
In this first release, there are 15 metrics across three different reports. See the video below or keep reading to get an introduction.
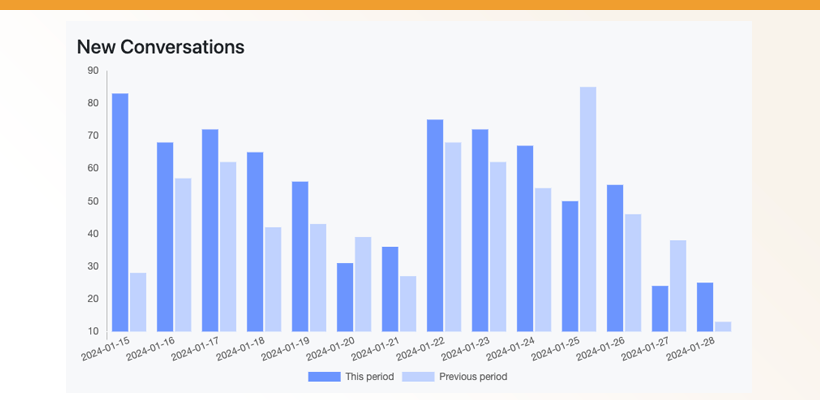
Conversations
The conversations section gives insight into the number of new conversations, how many are pending and open, and how many you’ve re-opened.
Use this to get an insight into how many conversations you receive in the different inboxes, channels or with various tags across time.
Busyness
The busyness section shows you at what time of the day and week your team is most busy. It covers new conversations, messages received and messages sent. Use this to see if you need to reallocate resources to be better available when your customers are contacting you.
Effectiveness
The effectiveness section lets you see how effective you and your team are at handling your customer's questions. It gives you insights into how many conversations you’ve replied to, messages you’ve sent and (perhaps more importantly) the median time from a conversation is created until it receives its first reply or is closed.
Filter and drill down into the data
For every report, you can drill down into the data and zoom in on:
- One or more inboxes
- One or more channels
- One or more tags
- One or more specific users (only on the effectiveness report)
And, of course, select the time frame for which you want to see data. The graphs also compare your selected time frame with the previous period. If you wish to see data for this month, corresponding data for the previous month is added to the graph for comparison.
Export data
Sometimes, you need to work with the report data in other formats or compare it to other data from your business. To accommodate that, we’ve added an Export feature that lets you download all the report data you see in CSV or Excel format.
The first 15 metrics are available now. They are updated daily, during night-time.
If you have any questions or if there are reports or metrics you think are missing, don’t hesitate to contact us and let us know.

 to stay in touch.